4.14. Posterior Investigation
Phosphoros provides a tool for the visualization of multi-dimensional likelihoods and posterior distributions. It is available only in the CLI.
As a first step, users have to generate FITS files, one per source, containing the likelihood and/or the posterior distributions. This is enabled by:
(GUI) clicking on the
Output Posteriortab in the5. Input/Outputsub-panel of theCompute Redshiftwindow;(CLI) setting the
--create-output-likelihoodsand/or--create-output-posteriorsoptions of thecompute_redshiftaction asYES.
The action to call the visualization tool is plot-posterior (or
PP). It requires to specify the qualified name of the FITS file
containing the likelihood or the posterior distribution for a specific
source and the type of plot to show, by the command line:
> Phosphoros PP --f <path>/<name file> -p <plot type>
The <plot type> arguments are Ebv, Sed, Z, Sed-Z,
Ebv-Z, Sed-Ebv, corresponding to 1D/2D plots of
the \(E_{B-V}\) value, SED template and redshift
parameters. Moreover, the argument Sed-Ebv-Z displays a 3D
density plot of the three parameters.
An example of Ebv-Z plot is shown in Fig. 4.14.
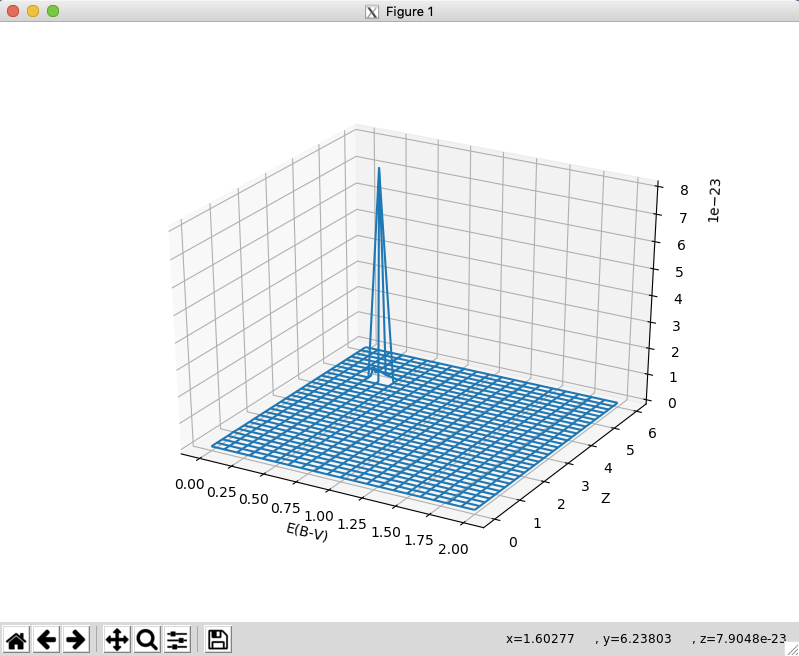
Fig. 4.14 Example of Ebv-Z plot
Note
The axes collapse is done as simple addition. For a more correct
(Bayesian) axes collapse, see the 1D PDF outputs from the
compute_redshift action.